Power BI - Available Panels
Description
iDynamics Commissions Analytics offers a variety of pages that deliver valuable insights into both sales and the commissions they generate.
Users can break down and analyze commissions and sales data in detail, while also maintaining a high-level view through key performance indicators (KPIs) included in the dashboard. Among other things, the platform enables analysis of:
- Overall commission performance
- Year-over-year KPI trends with analytical breakdowns
- Customer, product, and salesperson trends over time
- Detailed insights into customers, products, and sales staff
- Sales and commission structures, with filtering by dimensions
In addition, iDynamics Commissions Analytics includes two key advanced features: multi-currency analysis and multi-company analysis.
Multi-Currency Analysis
The dashboard is fully equipped to support scenarios where a company operates in multiple currencies. For instance, if commission payments to a salesperson are made in a currency different from the company’s local currency, the dashboard will detect and appropriately convert these values to the local currency.
This also applies to customers who transact in a currency different from the company’s base currency. For example, if the company operates in euros (€) but serves a customer invoicing in US dollars ($), the dashboard will calculate and display all relevant sales and commission metrics in the company’s local currency.
In this case, iDynamics Commissions Analytics includes a currency selector on the main page. Based on the selected currency, only companies whose local currency matches the selected one will be available for analysis. Regardless of transaction currency, all results are converted and presented in the company’s local currency for consistency.
The local currency for each company can be found in the General Ledger Setup section within Business Central.
Multi-Company Analysis
iDynamics Commissions Analytics supports consolidated analysis across all companies within your Business Central environment—provided that their local currency matches the currency selected in the dashboard filter.
After selecting a currency, users will be able to view and compare sales and commissions across all companies with that currency, either collectively or individually. It’s important to note that cross-company analysis is only possible when all selected companies share the same local currency. If multiple companies operate in one currency and another uses a different one, that third company must be analyzed separately by selecting its currency in the filter.
Commissions Analytics Dashboard
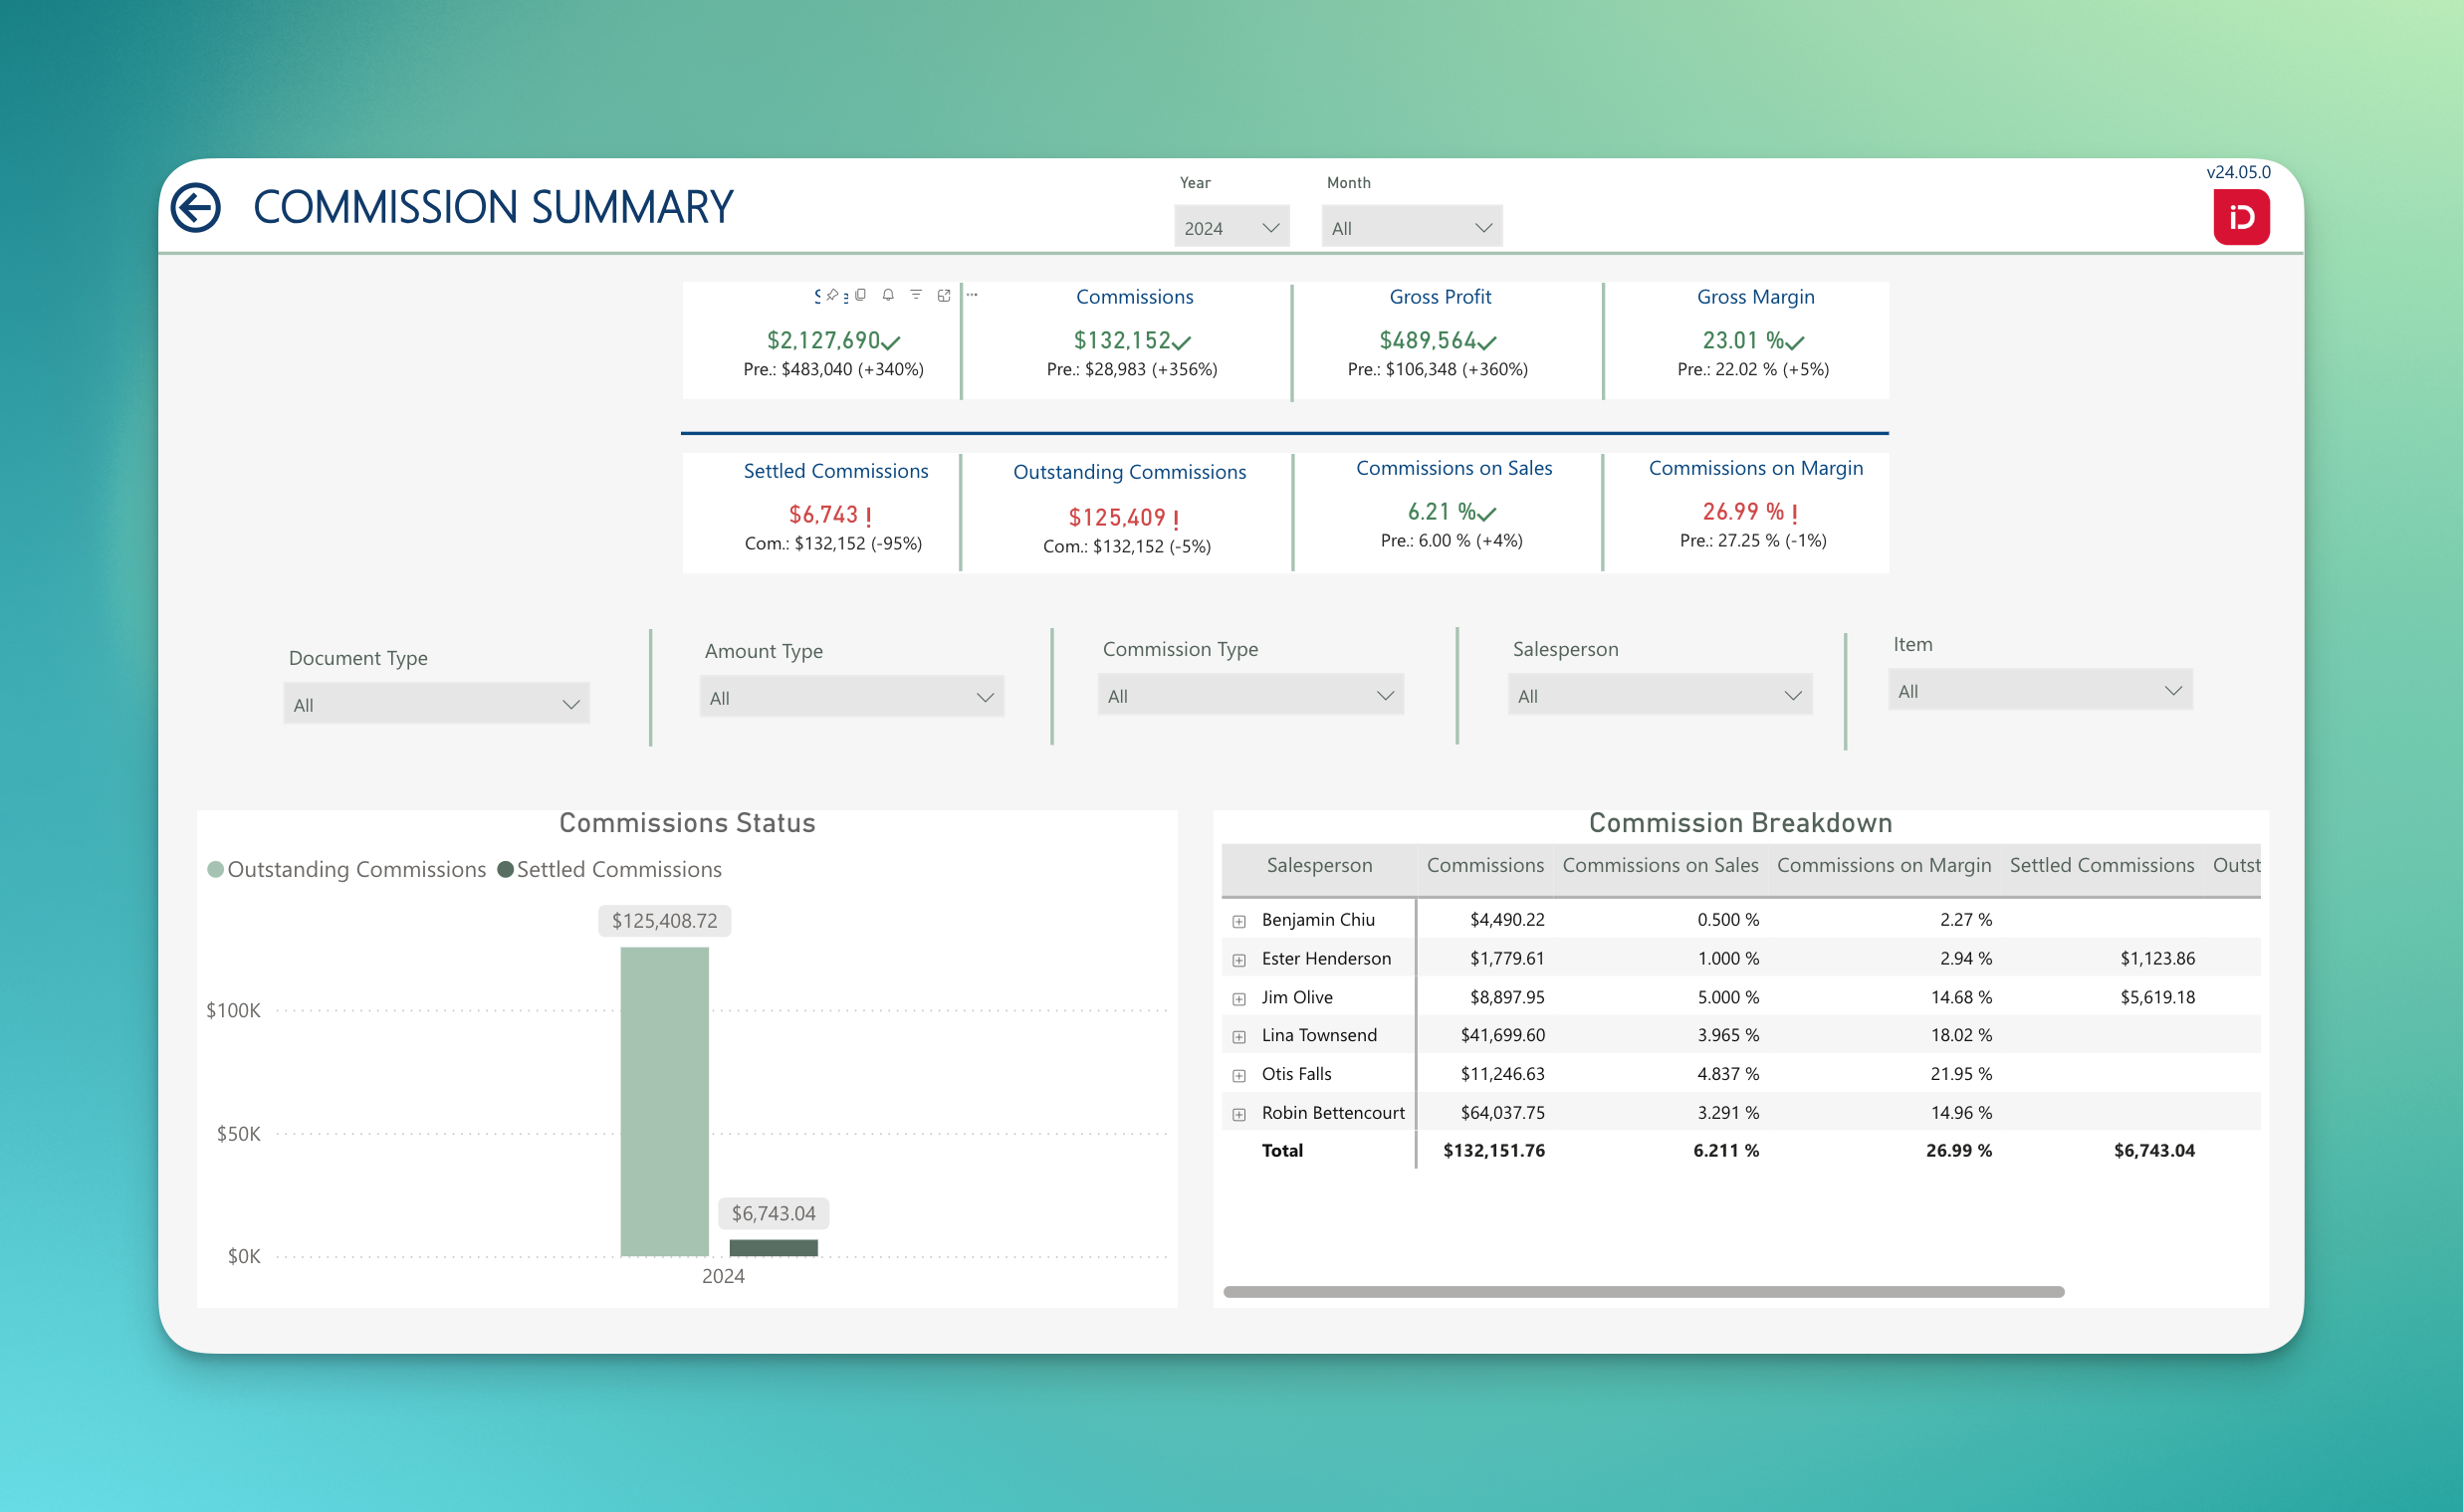
Commissions Summary
This panel provides users with a clear snapshot of commission activity, displaying eight key KPIs along with a comparison to the same period in the previous year.
In addition to KPIs, the panel includes details on settled and pending commissions, as well as breakdowns by salesperson, month, document number, and invoice.
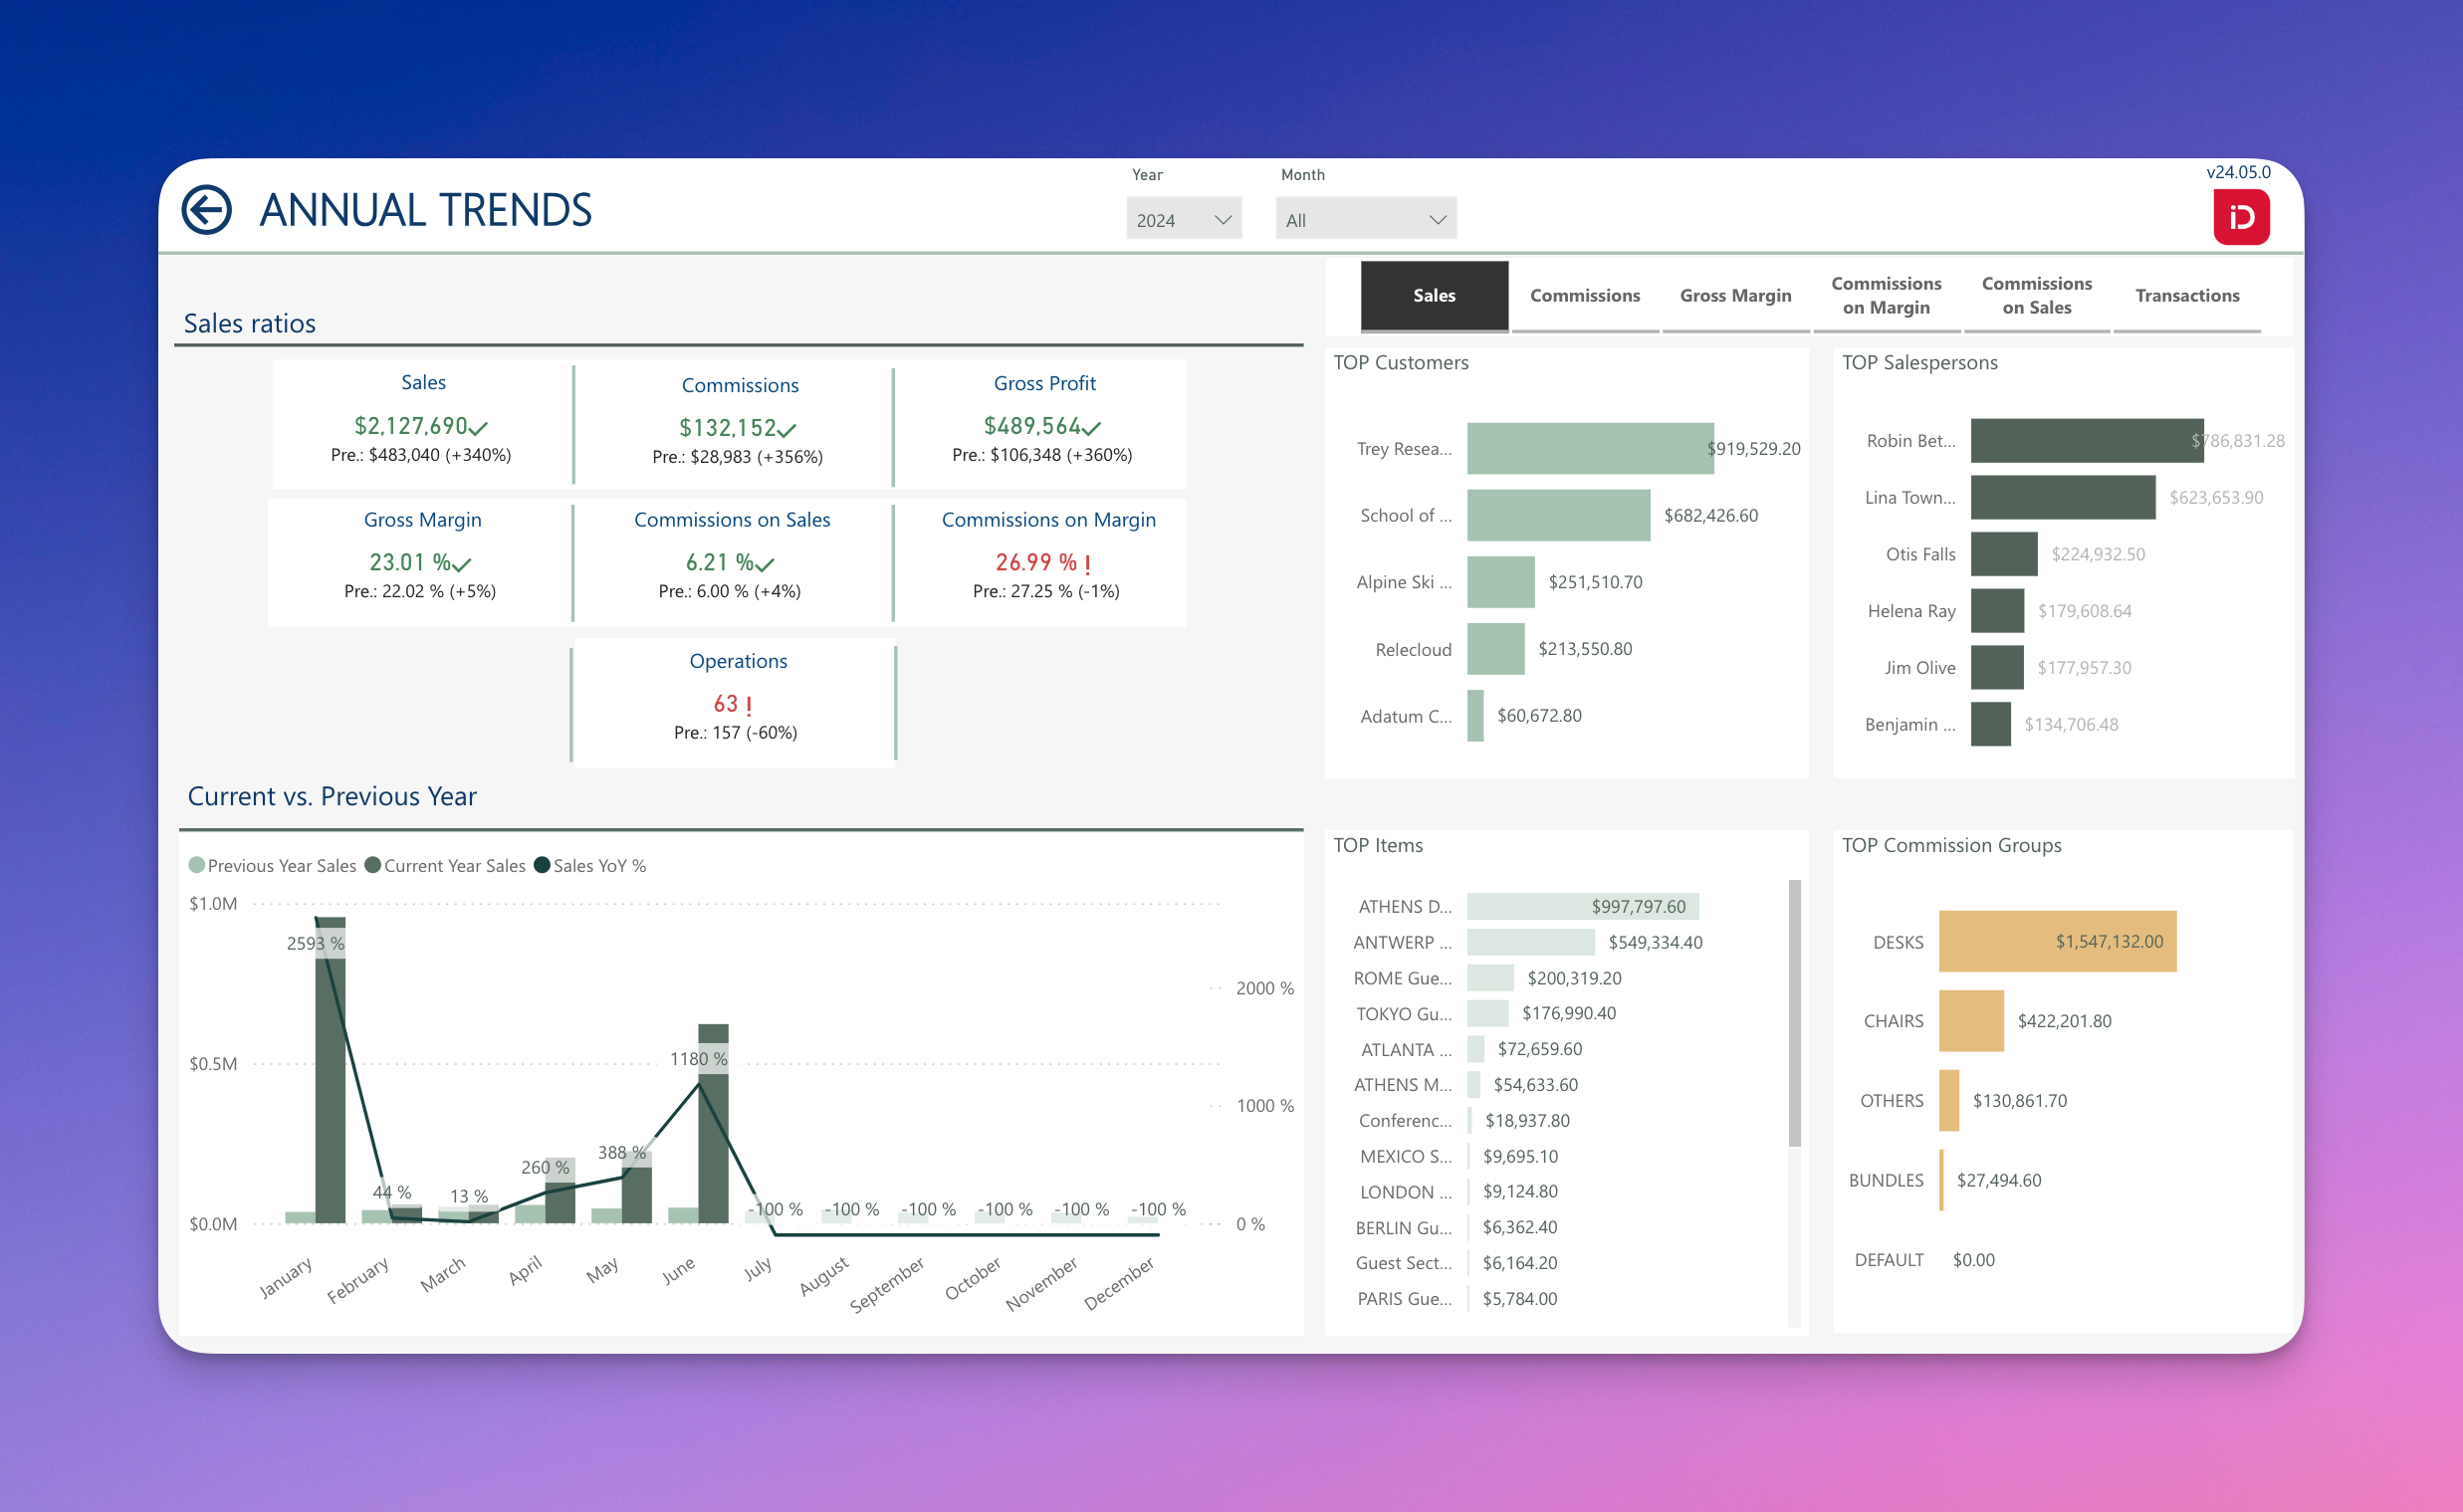
Annual Trends
The Annual Trends panel presents a global overview of performance across the year. Tabs in the top-right corner allow users to toggle between views for sales, commissions, and margins.
On the right-hand side, graphical breakdowns provide detailed insights into the selected KPI by customer, salesperson, product, and commission group. Each visualization includes tooltips that offer further detail—hovering over a chart will display the associated information.
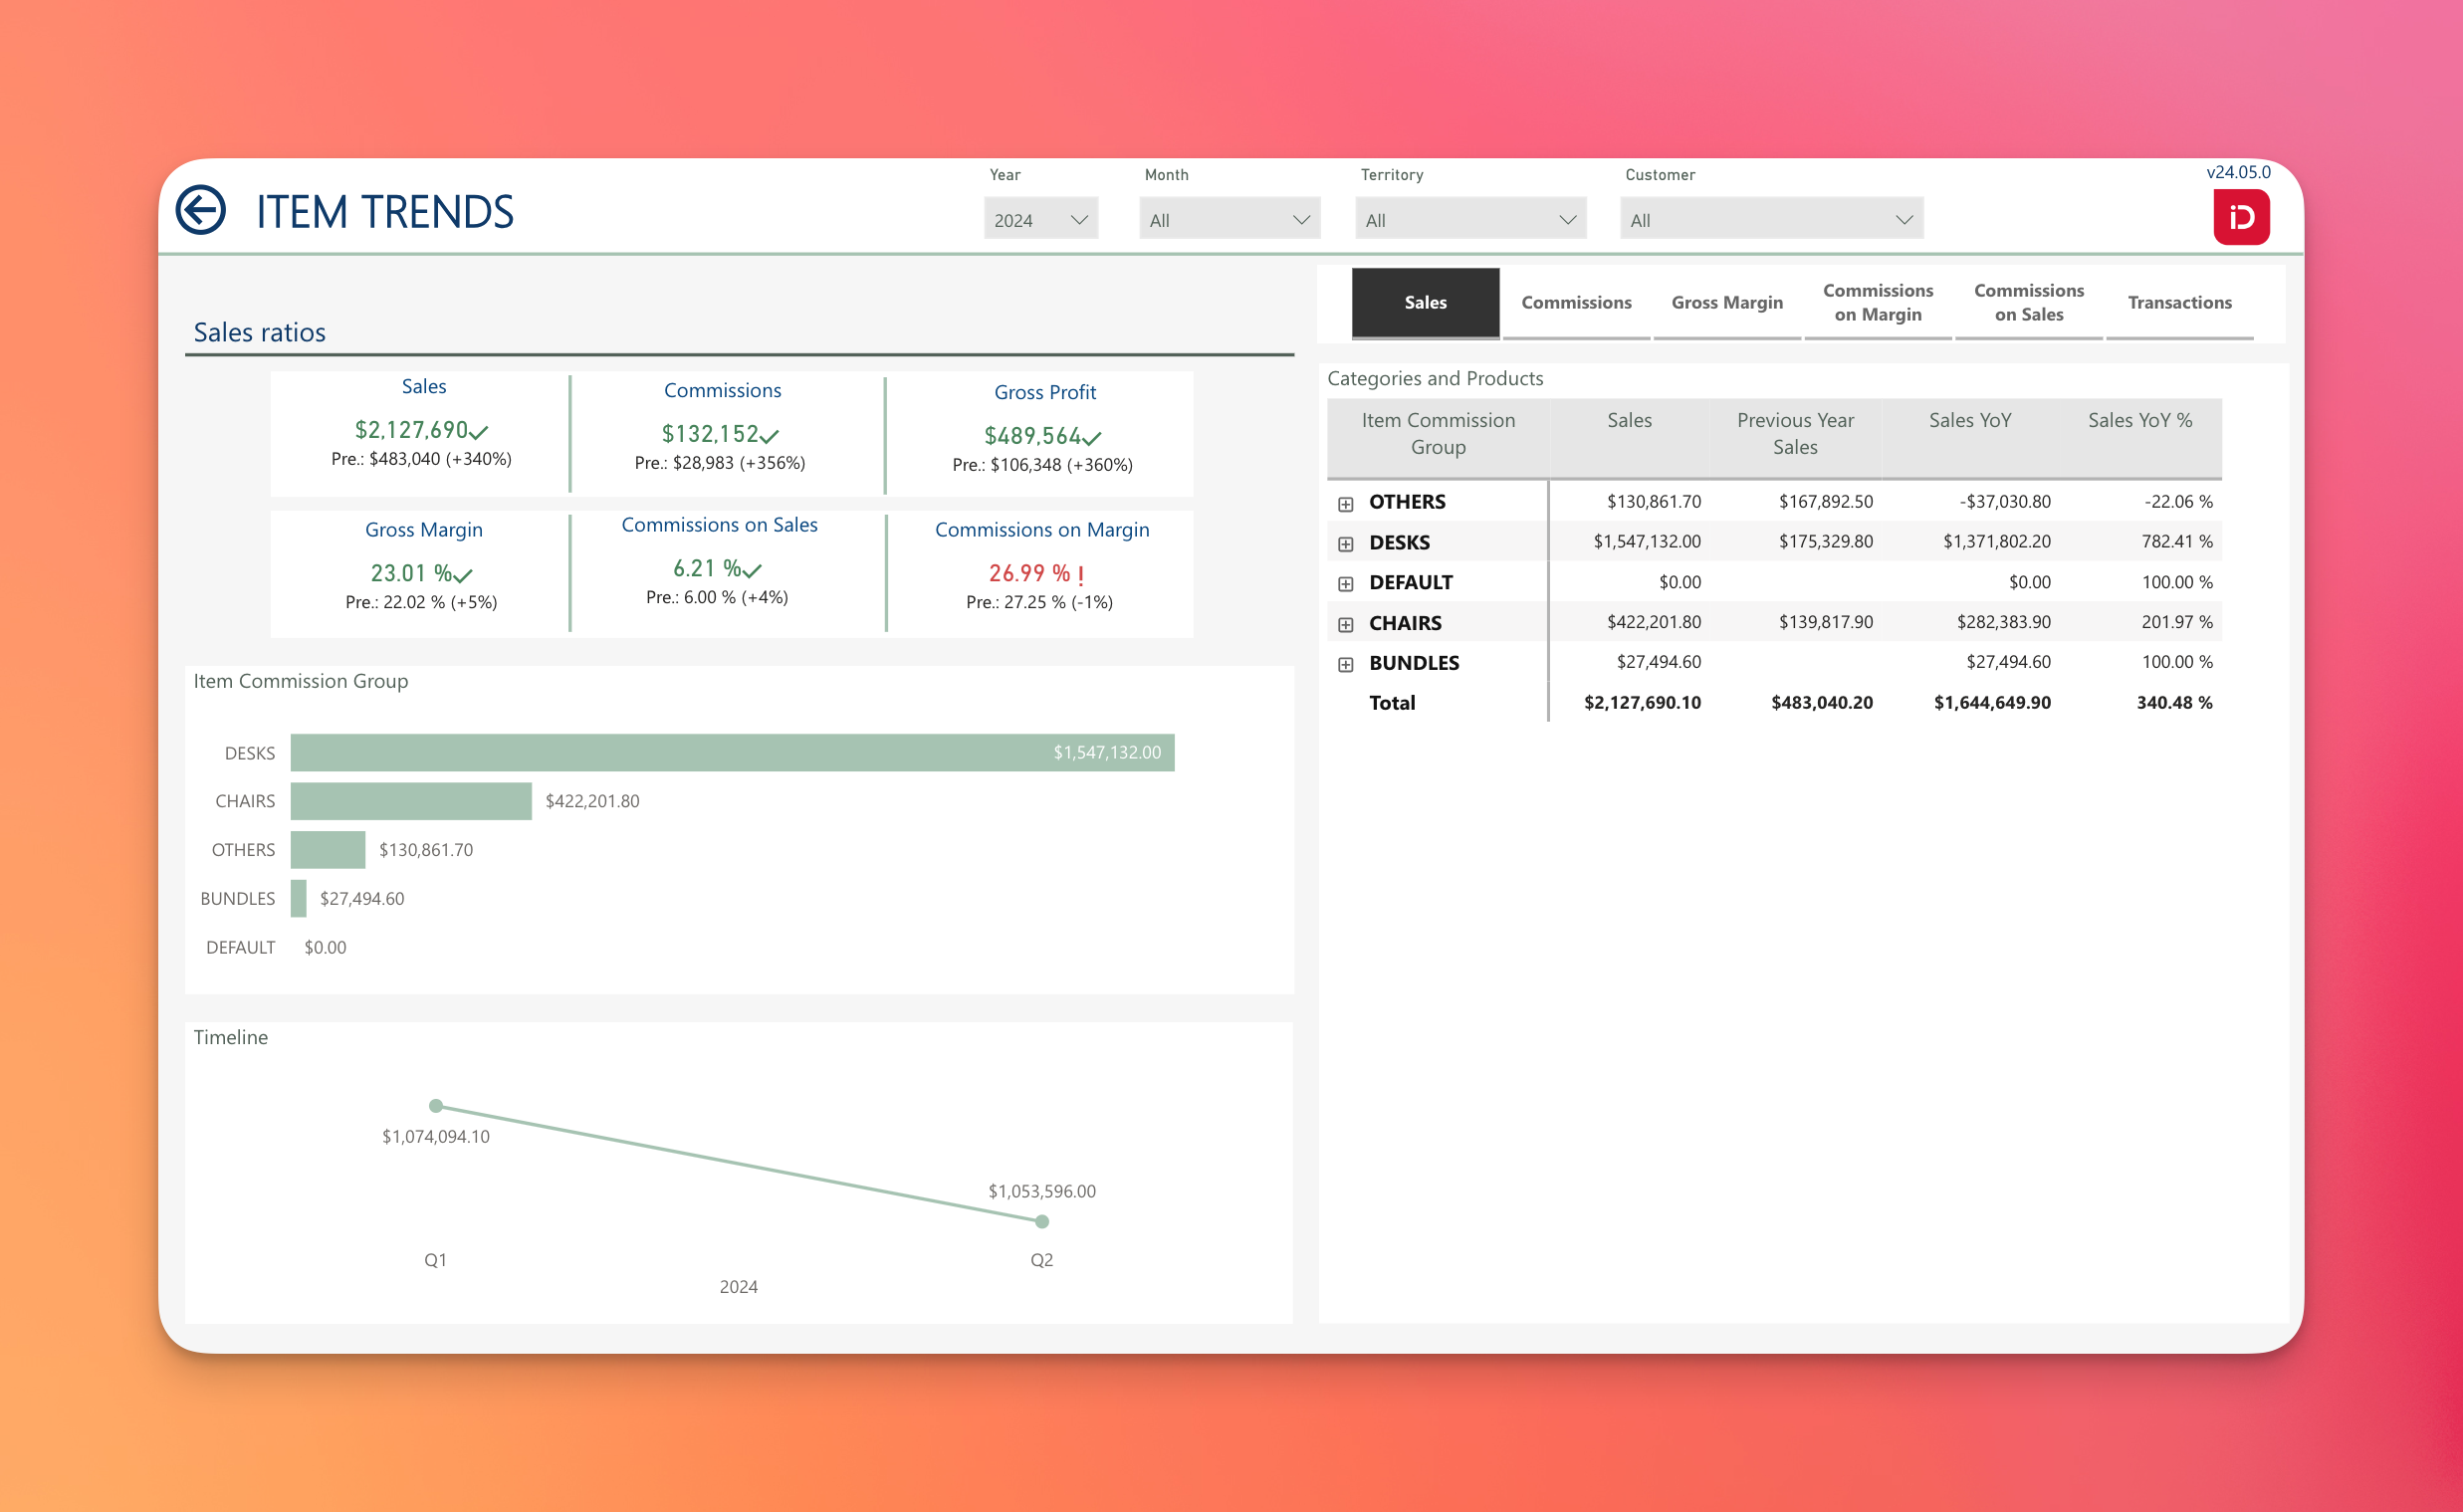
Customer, Item and Salesperson Trends
These panels—along with their corresponding detail views—offer a more targeted analysis of these three Business Central entities.
Users can explore trends in sales, commissions, transactions, and margins, filtered by customer, product type, or salesperson. This supports deeper insight and time-based analysis within each of these dimensions.
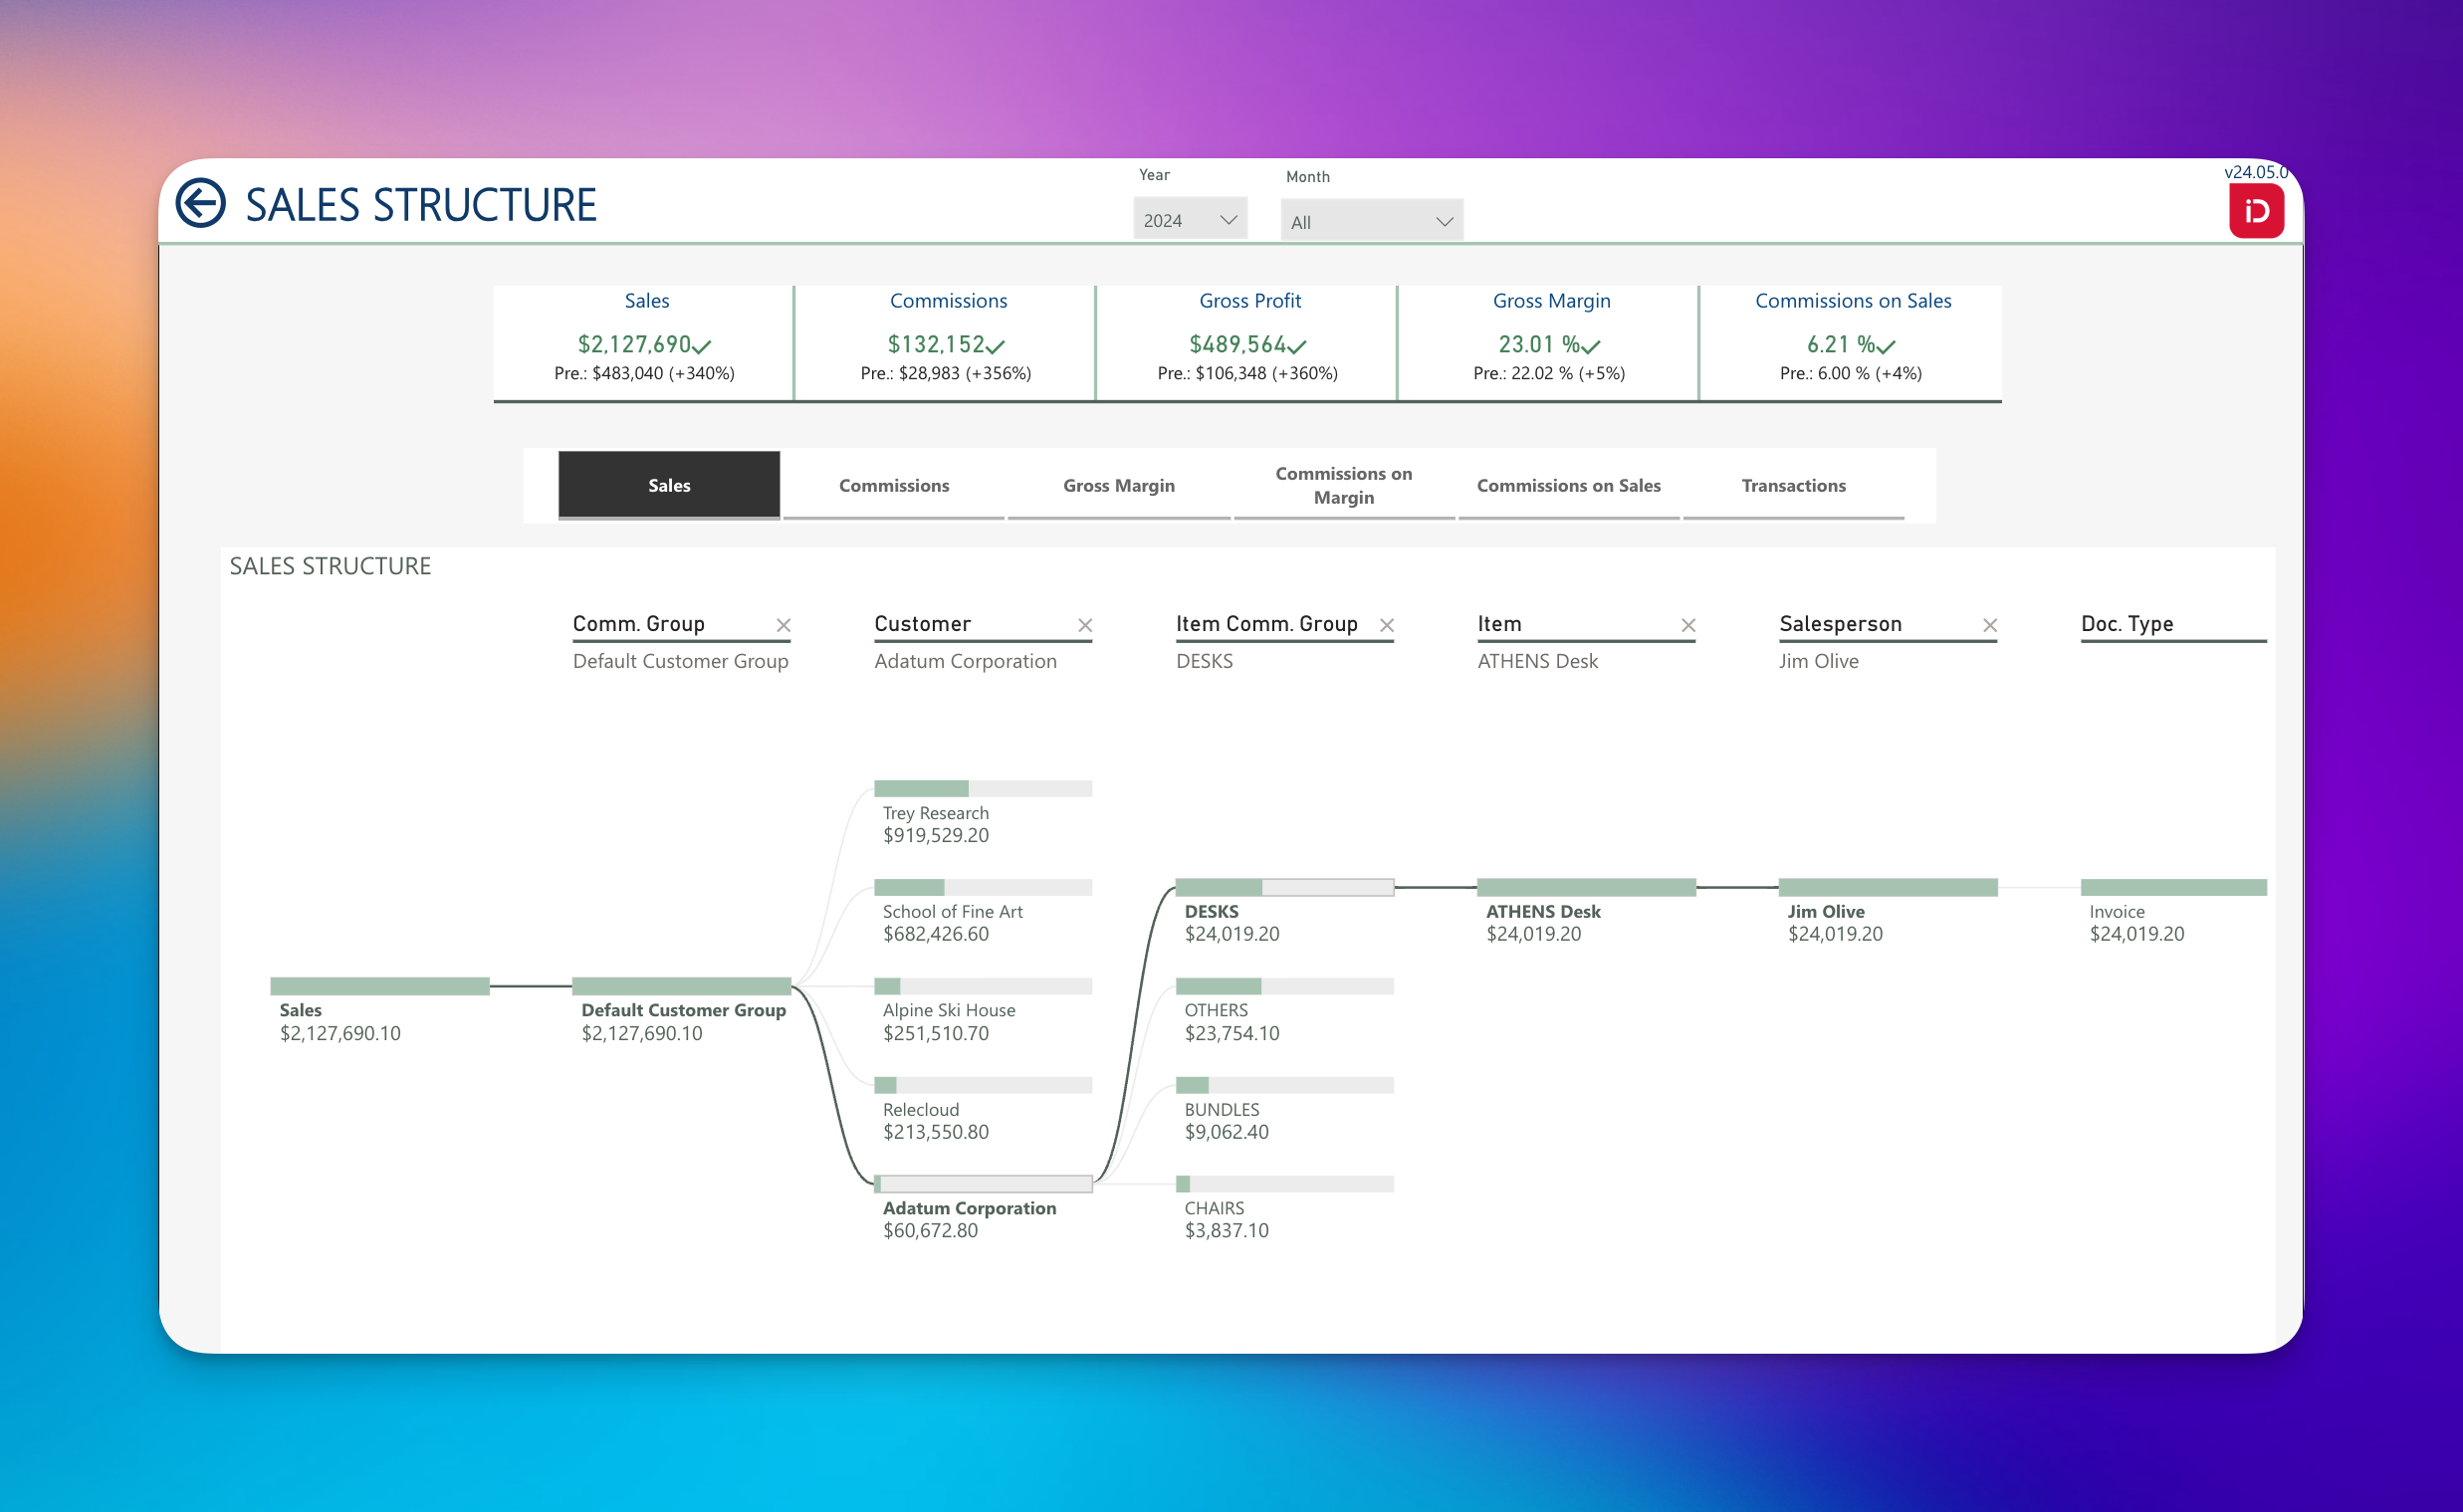
Sales Structure
This page provides an at-a-glance overview of top-performing customers, products, and product groups, forming the core of the company’s sales structure.
Beyond sales data, the dashboard includes breakdowns of commissions, transactions, and margins by dimensions such as salesperson, commission group, product, or document type.
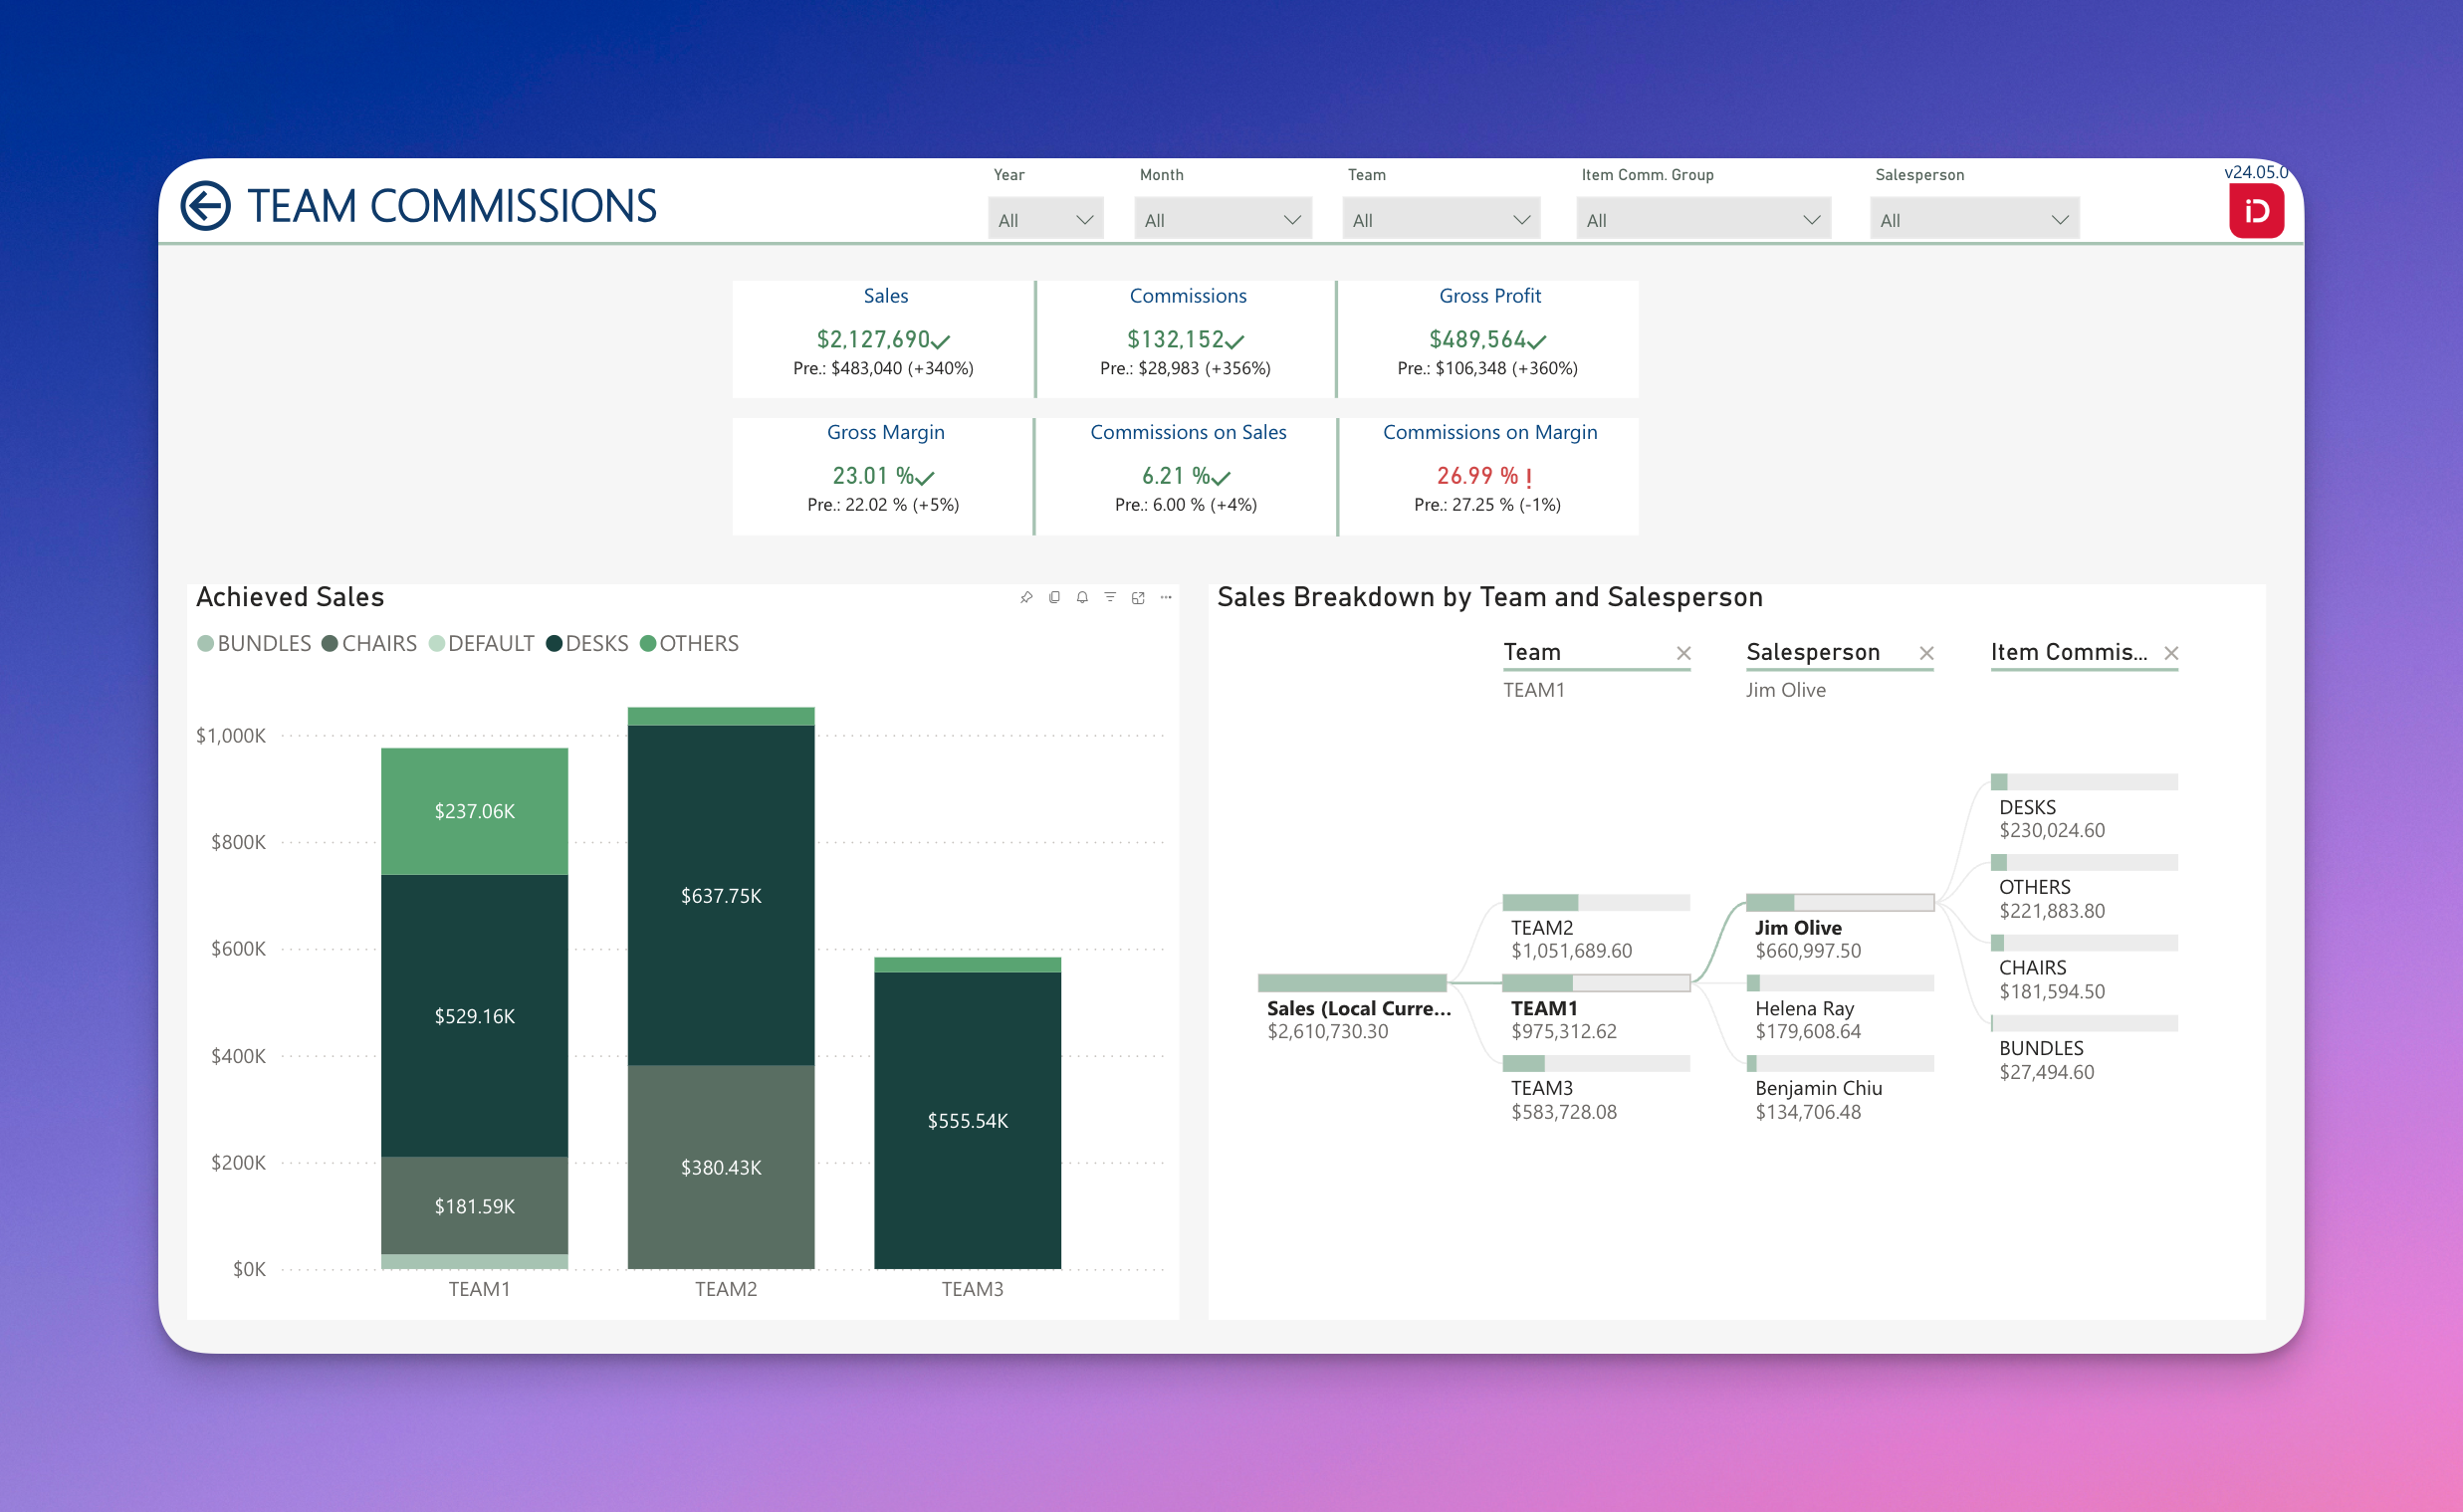
Team Commissions
This panel highlights performance at the team level, identifying which teams are generating the most revenue, the types of products sold by each, and the percentage contribution of each team member.
It includes both stacked bar charts and hierarchical views, offering a comprehensive visual summary of team-based sales activity.
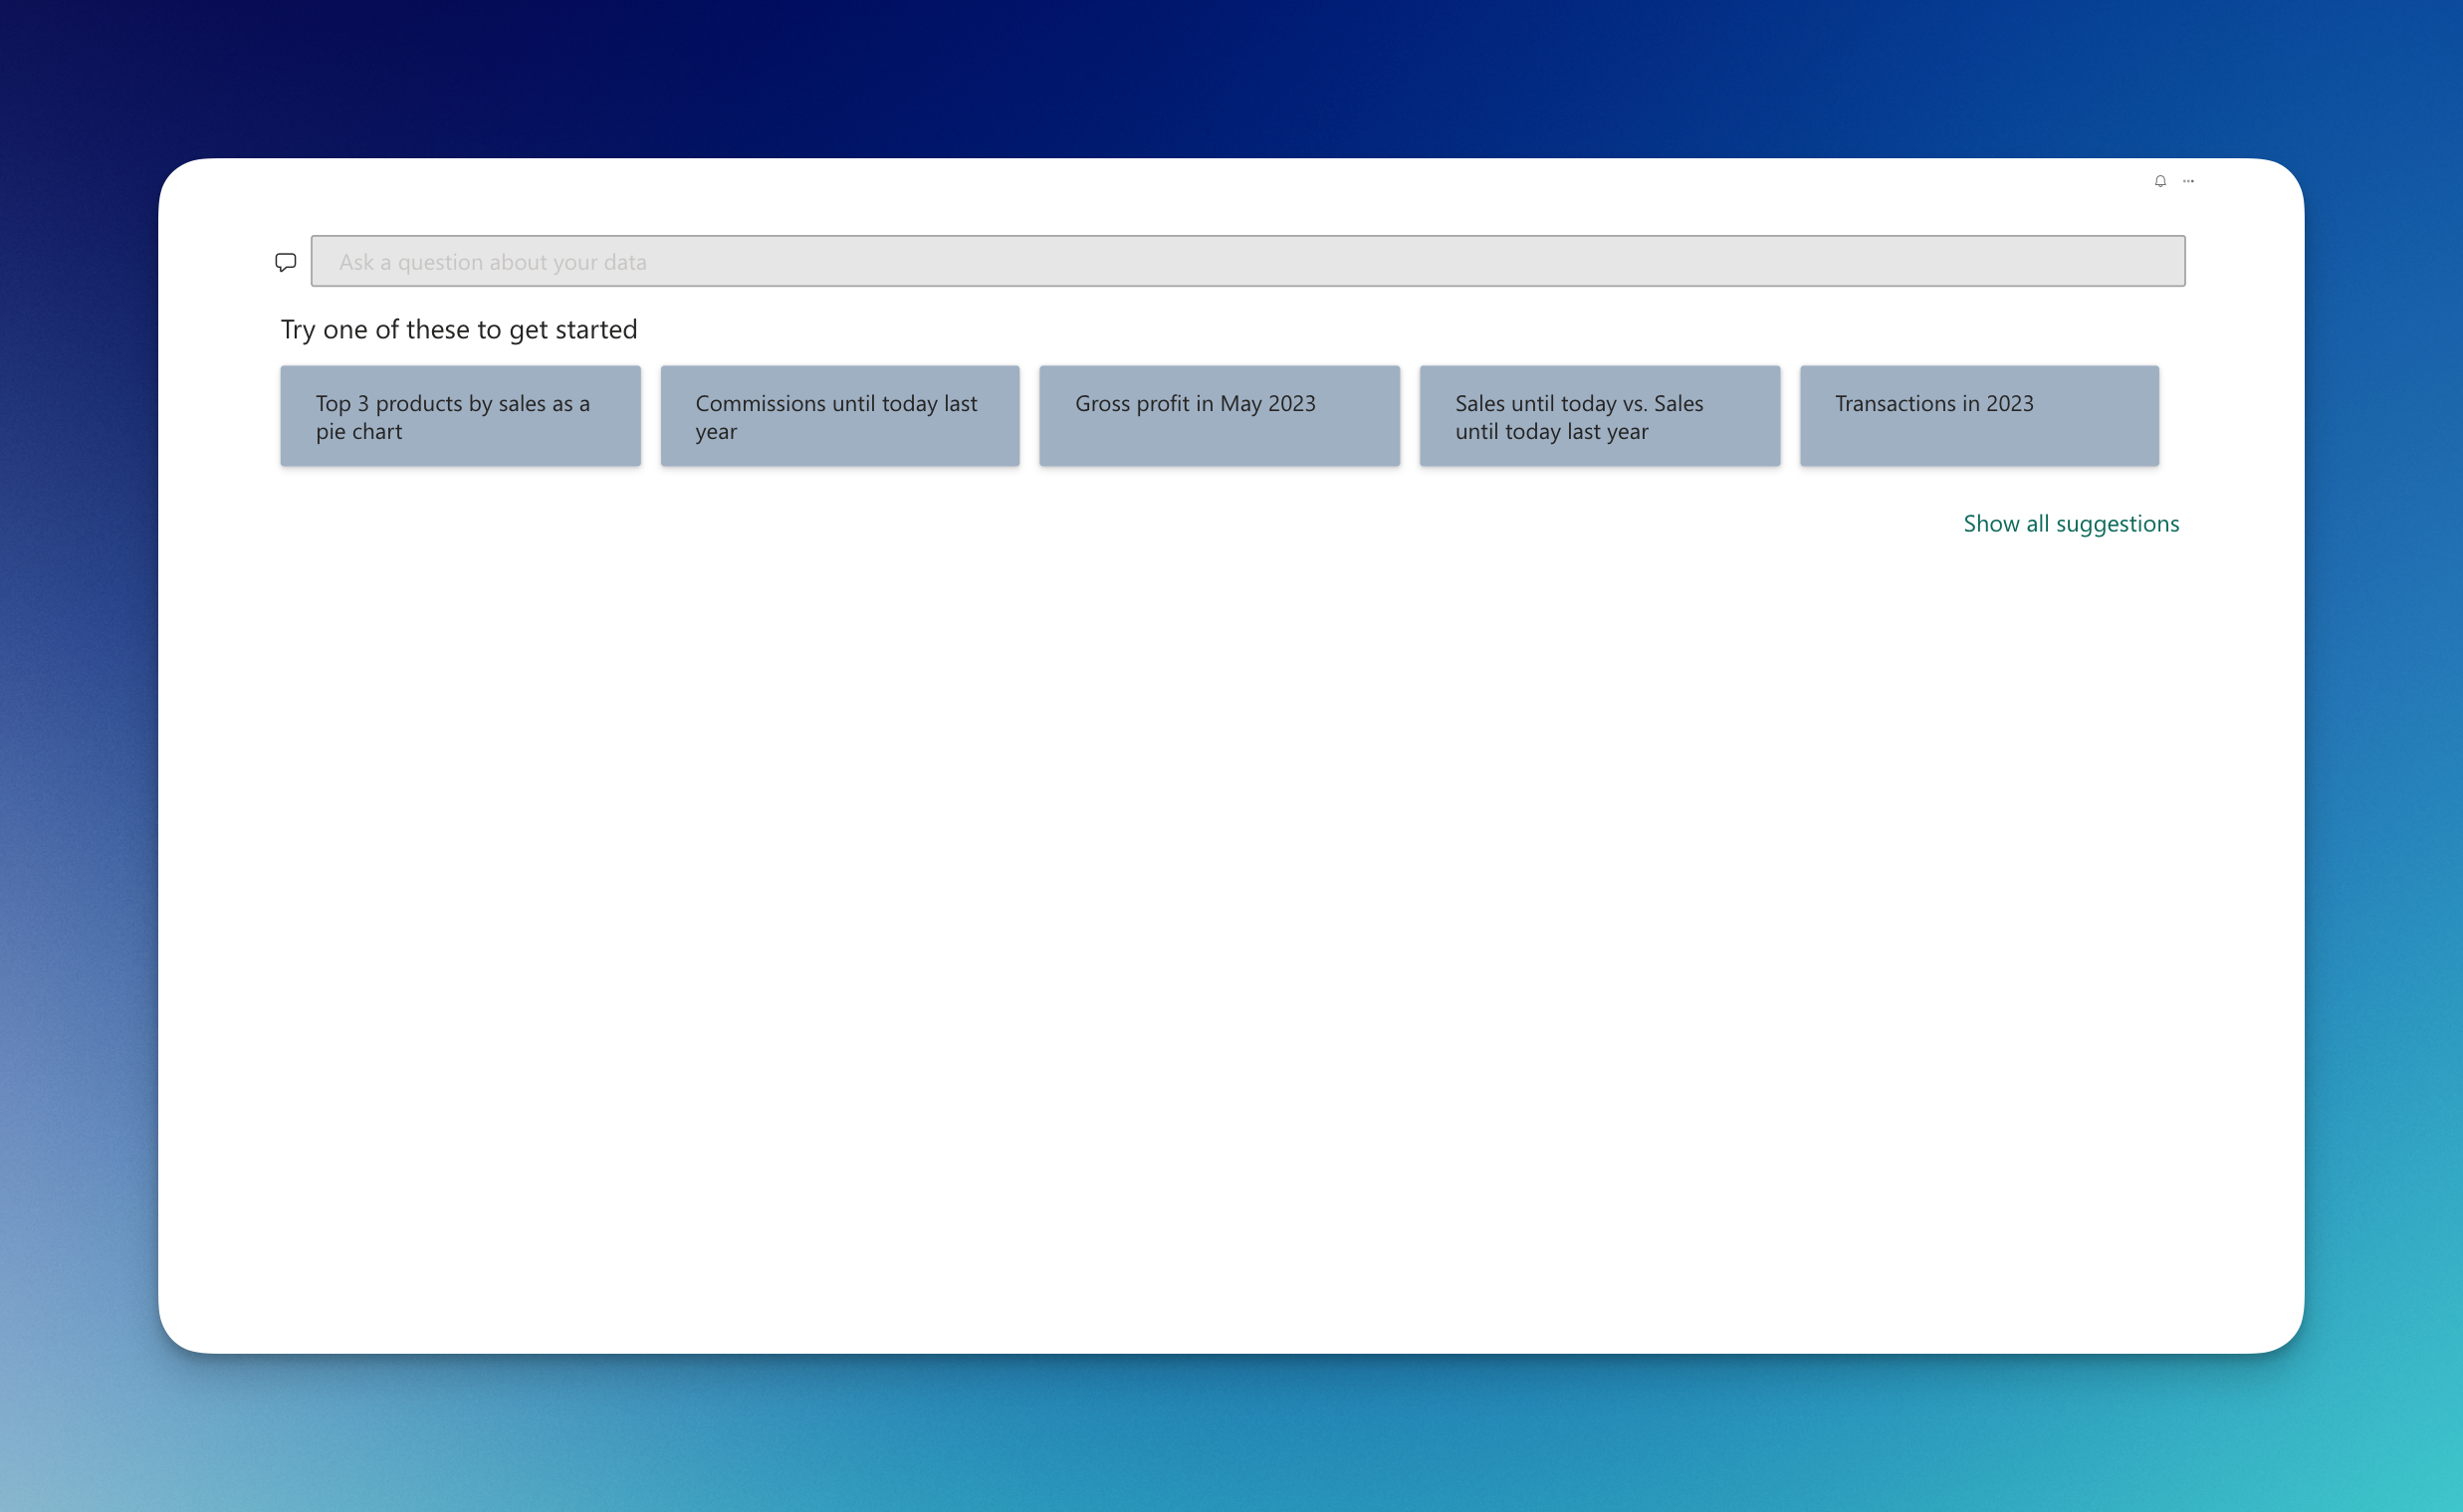
Ask Power BI
Looking for specific data not included in the dashboards above? Use Power BI’s natural language query feature to ask questions directly and get insights based on the available data in iDynamics Commissions Analytics.
Suggested questions are also available for quick access—simply click on a query to see results immediately.